|
|
|
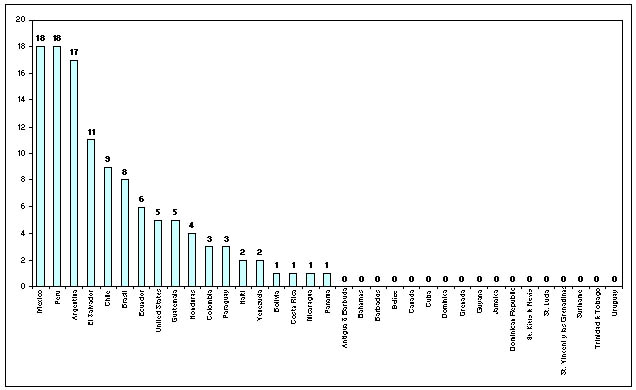
3. Total number of petitions transmitted during 2003 by country.
This graph illustrates the total petitions transmitted between January 1 and December 31, 2003, according to the OAS member states in respect of which the petitions were presented.
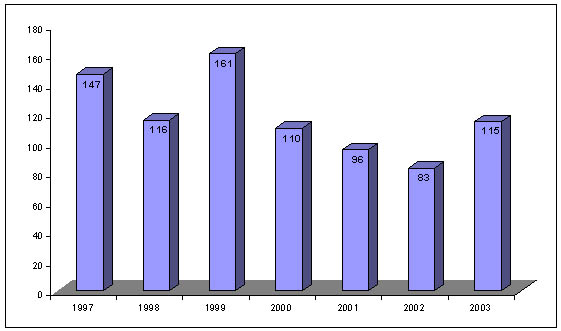
4. Total number of petitions transmitted by year.
The preceding graph shows the total number of petitions transmitted since 1997.
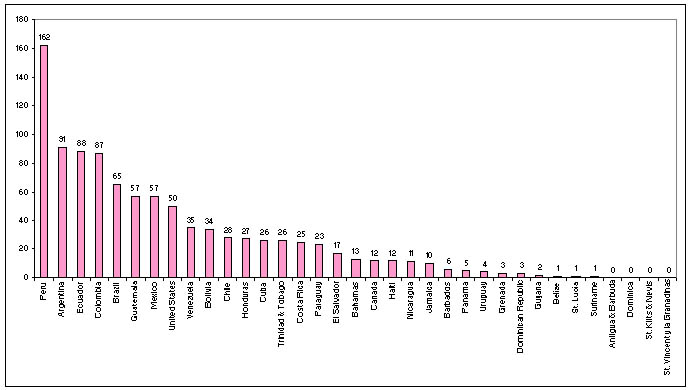
5. Total number of cases and petitions being processed by country.
This graph includes the total number of cases and petitions pending before the Commission and their breakdown by OAS member state in descending order by country. [ Table of Contents | Previous | Next ] |